Beware with Geekbench v6 results!
Geekbench is a widely renowned benchmarking tool that I have personally used for several years to compare various machines I have access to. Among them are my desktop and my laptop, featuring an i7 2600 and an i5 7300HQ, respectively.
I have been using both machines for many years, and their performance is remarkably similar. This has been confirmed through synthetic benchmarks as well as real-world use cases over the years, such as lengthy program builds, and many other CPU-bound tasks.
Recently, I ran Geekbench v6.2.0 on both my machines, and a significant surprise occurred:
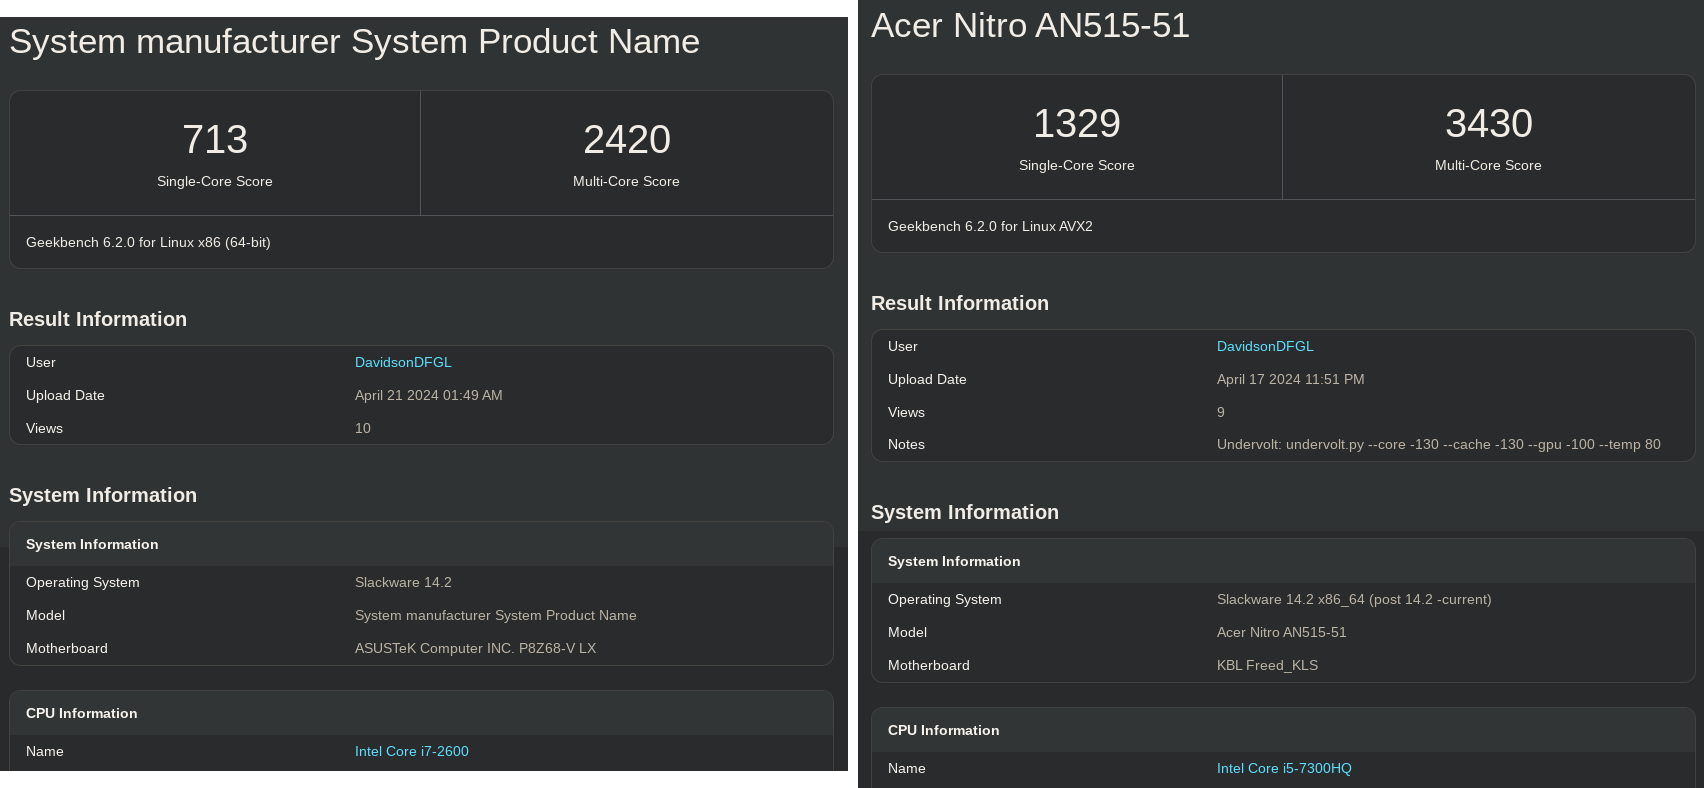
Image 1: My desktop, and my laptop, respectively
This had never happened before: a nearly 50% difference is undeniably substantial! I have consistently run benchmarks on these two machines, including (but not limited to):
- Geekbench v5: i5 7300HQ v5 and i7 2600 v5
- PassMark: i5 7300HQ vs i7 2600
- Stress-NG:
# i5 7300HQ:
$ time ./stress-ng --matrix 0 -t 30s --metrics-brief
stress-ng: info:  [5690] setting to a 30 secs run per stressor
stress-ng: info:  [5690] dispatching hogs: 4 matrix
stress-ng: metrc: [5690] stressor       bogo ops real time  usr time  sys time   bogo ops/s     bogo ops/s
stress-ng: metrc: [5690]                           (secs)    (secs)    (secs)   (real time) (usr+sys time)
stress-ng: metrc: [5690] matrix           353700     30.00    119.94      0.00     11789.51        2948.90
stress-ng: info:  [5690] skipped: 0
stress-ng: info:  [5690] passed: 4: matrix (4)
stress-ng: info:  [5690] failed: 0
stress-ng: info:  [5690] metrics untrustworthy: 0
stress-ng: info:  [5690] successful run completed in 30.01 secs
# i7 2600
$ time ./stress-ng --matrix 0 -t 30s --metrics-brief
stress-ng: info:  [1465] setting to a 30 secs run per stressor
stress-ng: info:  [1465] dispatching hogs: 8 matrix
stress-ng: metrc: [1465] stressor       bogo ops real time  usr time  sys time   bogo ops/s     bogo ops/s
stress-ng: metrc: [1465]                           (secs)    (secs)    (secs)   (real time) (usr+sys time)
stress-ng: metrc: [1465] matrix           455846     30.00    239.97      0.00     15194.20        1899.56
stress-ng: info:  [1465] skipped: 0
stress-ng: info:  [1465] passed: 8: matrix (8)
stress-ng: info:  [1465] failed: 0
stress-ng: info:  [1465] metrics untrustworthy: 0
stress-ng: info:  [1465] successful run completed in 30.01 secs
And in all my tests —literally all of them (as evident above)— I had never encountered such a significant difference, which typically remains around a maximum of 10%.
What's Changed?
A discerning reader will notice a subtle distinction at the top, just below the
scores, between the benchmarks: Geekbench 6.2.0 for Linux AVX2 for the i5
and Geekbench 6.2.0 for Linux x86 (64-bit) for the i7. Does this resolve the
issue? Did the i5 run with AVX2 support while the i7 did not, thereby explaining
the discrepancy in benchmarks and everything else, right?
Unfortunately, no.
Upon downloading Geekbench v6.2.0, we observed the following files:
$ ls -lah
total 477M
drwxr-xr-x 2 david users 4.0K Apr 23 22:53 .
drwxr-xr-x 4 david users 4.0K Apr 23 22:53 ..
-rw-r--r-- 1 david users 302M Sep 11  2023 geekbench-workload.plar
-rw-r--r-- 1 david users 4.2M Sep 11  2023 geekbench.plar
-rwxr-xr-x 1 david users 3.4M Sep 11  2023 geekbench6
-rwxr-xr-x 1 david users  88M Sep 11  2023 geekbench_avx2
-rwxr-xr-x 1 david users  80M Apr 23 22:53 geekbench_x86_64

$ md5sum *
fc758366e0dd1457875c0c97222365b4  geekbench-workload.plar
f67c40302b064de7c06e3fb9567a7ba0  geekbench.plar
1680c4f456ece1c9661bb6f26991fdb9  geekbench6
00e848cea509532ebf103f215c3db949  geekbench_avx2
f4d9d9b019f052e8fad0b59fccfd1e2f  geekbench_x86_64
The geekbench6 acts as a 'dispatcher', meaning it selects the appropriate
executable based on the CPU's supported features. The other two binaries likely
represent a version with AVX2 and a generic x86_64, presumably without
SIMD code, correct?
Ultimately, what matters is that I should also be able to manually execute
geekbench_x86_64 on both machines to have an identical comparison
environment (since my i7 only supports up to AVX1).
Here is the new result from my i5:
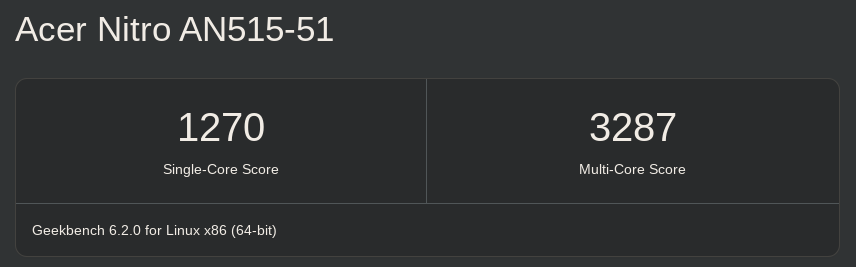
Image 2: i5 7300HQ running geekbench_x86_64 with Geekbench v6.2.0
Indeed, there was a slight reduction in the difference, but it's still significantly large compared to the other benchmarks shown earlier, even when compared to Geekbench v5 itself!
I also considered the operating system, libraries, faulty hardware, thermal throttling, etc., but the official results for the i5 and i7 also follow the same pattern... why?
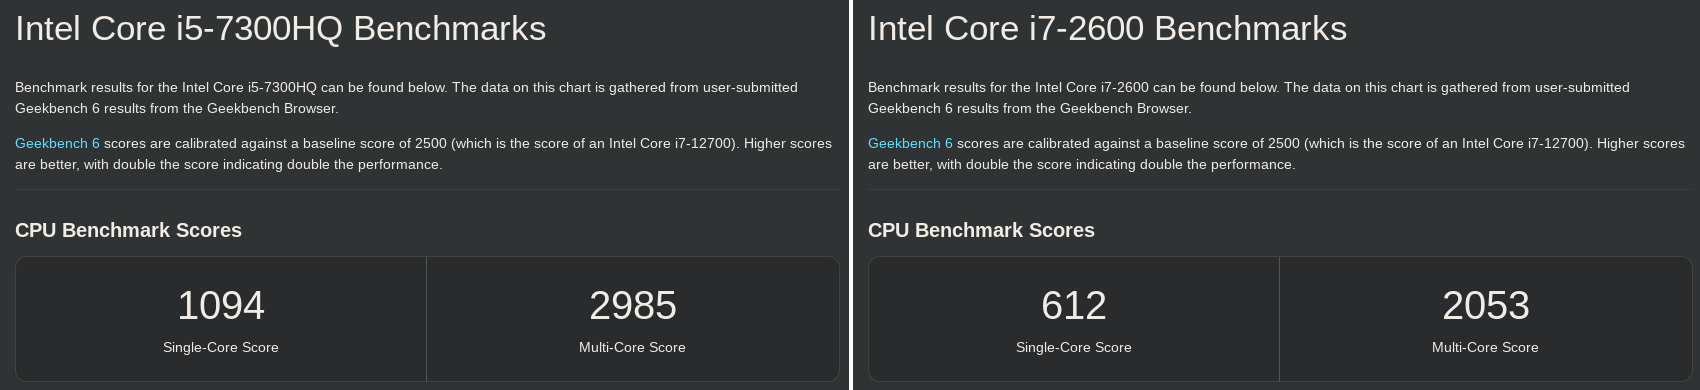
Image 3: Official i5 and i7 results for Geekbench v6
Is the execution truly identical on both machines?
Initial Hypothesis: Execution Path Analysis
If a significant difference persists, it may indicate a potential variation in the execution flow between the two machines, suggesting that the executed code is not identical... although that should be impossible, right?
How do we examine the execution path? Enter perf!
The initial idea is quite straightforward:
- Sample the Geekbench run using perf on both systems
- Compare the reports
- Profit
Let's get started:
$ time perf record --call-graph dwarf ./geekbench_x86_64
Geekbench 6.2.0 : https://www.geekbench.com/

Geekbench 6 requires an active internet connection and automatically uploads
benchmark results to the Geekbench Browser.

Upgrade to Geekbench 6 Pro to enable offline use and unlock other features:

  https://store.primatelabs.com/v6

Enter your Geekbench 6 Pro license using the following command line:

  ./geekbench_x86_64 --unlock <email> <key>

System Information
  Operating System              Slackware 14.2 x86_64 (post 14.2 -current)
  Kernel                        Linux 5.4.186 x86_64
  Model                         Acer Nitro AN515-51
  Motherboard                   KBL Freed_KLS
  BIOS                          Insyde Corp. V1.22

CPU Information
  Name                          Intel Core i5-7300HQ
  Topology                      1 Processor, 4 Cores
  Identifier                    GenuineIntel Family 6 Model 158 Stepping 9
  Base Frequency                3.50 GHz
  L1 Instruction Cache          32.0 KB x 2
  L1 Data Cache                 32.0 KB x 2
  L2 Cache                      256 KB x 2
  L3 Cache                      6.00 MB

Memory Information
  Size                          23.4 GB


Single-Core
  Running File Compression
  Running Navigation
^C[ perf record: Woken up 3194 times to write data ]
Warning:
Processed 107281 events and lost 38 chunks!

Check IO/CPU overload!

[ perf record: Captured and wrote 799.249 MB perf.data (100206 samples) ]


real  0m46.667s
user  0m26.732s
sys 0m1.794s

$ ls -lah perf.data
-rw------- 1 david users 800M Apr 24 21:14 perf.data
This isn't going well... 800MB for a brief test span... I B(genuinely) will not have enough disk space for extended minutes of execution.
A New Approach...
Let's examine the site's report for a benchmark with a significant discrepancy
and run only that particular test instead of the entire suite. This way, the
test will finish fast, and we won't
have an exponentially large perf.data output.
Reviewing the reports, the Object Detection test stands out as an excellent
candidate: scoring 66 versus 545 points on the i7 and i5, respectively.
Now, let's determine which flag is needed for Geekbench:
$ ./geekbench_x86_64 --help
Geekbench 6.2.0 : https://www.geekbench.com/

Usage:

  ./geekbench_x86_64 [ options ]

Options:

  -h, --help                  print this message
  --unlock EMAIL KEY          unlock Geekbench using EMAIL and KEY

  --cpu                       run the CPU benchmark
  --sysinfo                   display system information and exit
INTEL-MESA: warning: Performance support disabled, consider sysctl dev.i915.perf_stream_paranoid=0


  --gpu [API]                 run the GPU benchmark
                                API can be one of: OpenCL (default), Vulkan
  --gpu-list                  list available GPU platforms, devices and exit
  --gpu-platform-id ID        use GPU platform ID (default is 0)
  --gpu-device-id ID          use GPU device ID (default is 0)

  If no options are given, the default action is to run the CPU benchmark.
Hmm... there isn't one...? So, what's next? I'm unaware of any
perf flag that could assist with this.
Let's Hack?
The previous idea is good and indeed seems promising, but without an official way to run a single benchmark, let's add our own method of doing so!
Since the binary is not stripped, it wasn't exactly difficult to obtain the methods for all the benchmarks: I simply paused the running benchmark and analyzed the backtrace for potential candidate functions. After some time, I arrived at this:
+-------------------------------------------------------------------------------------------------------+
+ File offset  |  Mangled C++ symbol                        |  Demangled C++ symbol/function            +
+-------------------------------------------------------------------------------------------------------+
+   0x4b9370   |  _ZN23FileCompressionWorkload6workerEi     |  FileCompressionWorkload::worker(int)     +
+   0x3ccd80   |  _ZN18NavigationWorkload6workerEi          |  NavigationWorkload::worker(int)          +
+   0x4c1a20   |  _ZN20HTML5BrowserWorkload6workerEi        |  HTML5BrowserWorkload::worker(int)        +
+   0x3ee400   |  _ZN20PDFRenderingWorkload6workerEi        |  PDFRenderingWorkload::worker(int)        +
+   0x3f1d70   |  _ZN13PhotoWorkload6workerEi               |  PhotoWorkload::worker(int)               +
+   0x4b12c0   |  _ZN16ClangTBBWorkload6workerEi            |  ClangTBBWorkload::worker(int)            +
+   0x3f8810   |  _ZN14PythonWorkload6workerEi              |  PythonWorkload::worker(int)              +
+   0x496810   |  _ZN24AssetCompressionWorkload6workerEi    |  AssetCompressionWorkload::worker(int)    +
+   0x3e4ed0   |  _ZN23ObjectDetectionWorkload6workerEi     |  ObjectDetectionWorkload::worker(int)     +
+   0x499400   |  _ZN25BackgroundBlurTBBWorkload6workerEi   |  BackgroundBlurTBBWorkload::worker(int)   +
+   0x4bdcd0   |  _ZN27HorizonDetectionTBBWorkload6workerEi |  HorizonDetectionTBBWorkload::worker(int) +
+   0x4c3690   |  _ZN18InpaintTBBWorkload6workerEi          |  InpaintTBBWorkload::worker(int)          +
+   0x4bd560   |  _ZN14HDRTBBWorkload6workerEi              |  HDRTBBWorkload::worker(int)              +
+   0x4a72e0   |  _ZN14CameraWorkload6workerEi              |  CameraWorkload::worker(int)              +
+   0x3f97a0   |  _ZN19RaytraceTBBWorkload6workerEi         |  RaytraceTBBWorkload::worker(int)         +
+   0x3fb420   |  _ZN14SfMTBBWorkload6workerEi              |  SfMTBBWorkload::worker(int)              +
+-------------------------------------------------------------------------------------------------------+
The list above contains all the benchmark functions, but that alone is not sufficient. It's not as if I can invoke any of these functions from any point in the code.
Further analyzing the backtrace, I found these functions (mangled):
_ZN13SectionDriver3runE11SectionTypeSt3setI12WorkloadTypeSt4lessIS2_ESaIS2_EEPK15WorkloadOptions
_ZN14WorkloadDriver3runE11SectionType12WorkloadTypePK15WorkloadOptions
or (demangled):
SectionDriver::run(SectionType, std::set<WorkloadType, std::less<WorkloadType>, std::allocator<WorkloadType> >, WorkloadOptions const*)
WorkloadDriver::run(SectionType, WorkloadType, WorkloadOptions const*)
SectionDriver::run() iterates through the list of benchmarks and, for each one, invokes WorkloadDriver::run() with the appropriate benchmark code, specifically at:
_ZN13SectionDriver3runE11SectionTypeSt3setI12WorkloadTypeSt4lessIS2_ESaIS2_EEPK15WorkloadOptions:
[snip]
  3bb5f0: /----> 49 89 2e               mov    %rbp,(%r14)
  3bb5f3: |      49 83 47 18 08         addq   $0x8,0x18(%r15)
  3bb5f8: |      4c 8b 74 24 20         mov    0x20(%rsp),%r14
  3bb5fd: |      48 8d 3d dc 82 e4 02   lea    0x2e482dc(%rip),%rdi # 32038e0 <_ZTS15BrowserDelegate+0x7e>
  3bb604: |      31 f6                  xor    %esi,%esi
  3bb606: |      31 d2                  xor    %edx,%edx
  3bb608: |      31 c9                  xor    %ecx,%ecx
  3bb60a: |      45 31 c0               xor    %r8d,%r8d
  3bb60d: |      e8 7e 67 37 00         call   731d90 <je_mallctl>
  3bb612: |      41 8b 7e 14            mov    0x14(%r14),%edi
  3bb616: |      e8 95 54 1f 00         call   5b0ab0 <_ZN4base5sleepEj>
  3bb61b: |      49 83 c4 04            add    $0x4,%r12         ; increase benchmark pointer
  3bb61f: |      4d 39 ec               cmp    %r13,%r12         ; should end?
  3bb622: |      48 8b 6c 24 30         mov    0x30(%rsp),%rbp
  3bb627: |      0f 84 6b 01 00 00      je     3bb798 <_ZN13SectionDriver3runE11SectionTypeSt3setI12WorkloadTypeSt4lessIS2_ESaIS2_EEPK15WorkloadOptions+0x4b8>
  3bb62d: |      48 83 7d 20 00         cmpq   $0x0,0x20(%rbp)
  3bb632: |      0f 84 94 01 00 00      je     3bb7cc <_ZN13SectionDriver3runE11SectionTypeSt3setI12WorkloadTypeSt4lessIS2_ESaIS2_EEPK15WorkloadOptions+0x4ec>
  3bb638: |      41 8b 1c 24            mov    (%r12),%ebx       ; ebx = benchmark number
  3bb63c: |      48 8b 7c 24 28         mov    0x28(%rsp),%rdi
  3bb641: |      ff 55 28               call   *0x28(%rbp)
  3bb644: |      a8 01                  test   $0x1,%al
  3bb646: |      0f 85 4c 01 00 00      jne    3bb798 <_ZN13SectionDriver3runE11SectionTypeSt3setI12WorkloadTypeSt4lessIS2_ESaIS2_EEPK15WorkloadOptions+0x4b8>
  3bb64c: |      8b 7c 24 04            mov    0x4(%rsp),%edi
  3bb650: |      89 de                  mov    %ebx,%esi
  3bb652: |      e8 89 de 00 00         call   3c94e0 <_ZN8Metadata16workload_factoryE11SectionType12WorkloadType>
  3bb657: |      48 85 c0               test   %rax,%rax
  3bb65a: |      74 bf                  je     3bb61b <_ZN13SectionDriver3runE11SectionTypeSt3setI12WorkloadTypeSt4lessIS2_ESaIS2_EEPK15WorkloadOptions+0x33b>
          |
          |
          | Benchmark call:
  3bb65c: |      48 8b 7c 24 40         mov    0x40(%rsp),%rdi
  3bb661: |      8b 74 24 04            mov    0x4(%rsp),%esi
  3bb665: |      89 da                  mov    %ebx,%edx         ; edx = benchmark number
  3bb667: |      4c 89 f1               mov    %r14,%rcx
  3bb66a: |      e8 31 4f 00 00         call   3c05a0 <_ZN14WorkloadDriver3runE11SectionType12WorkloadTypePK15WorkloadOptions>
          |
          |
  3bb66f: |      48 89 c5               mov    %rax,%rbp
  3bb672: |      48 8b 44 24 30         mov    0x30(%rsp),%rax
  3bb677: |      48 8b 78 08            mov    0x8(%rax),%rdi
  3bb67b: |      48 8b 07               mov    (%rdi),%rax
  3bb67e: |      0f 57 c0               xorps  %xmm0,%xmm0
  3bb681: |      ff 50 10               call   *0x10(%rax)
  3bb684: |      4d 8b 77 18            mov    0x18(%r15),%r14
  3bb688: |      4d 3b 77 20            cmp    0x20(%r15),%r14
  3bb68c: \----- 0f 85 5e ff ff ff      jne    3bb5f0 <_ZN13SectionDriver3runE11SectionTypeSt3setI12WorkloadTypeSt4lessIS2_ESaIS2_EEPK15WorkloadOptions+0x310>
Once WorkloadDriver::run() is invoked (at 0x3bb66a), there are other
function calls that prepare the environment until the benchmark is actually
invoked. However, the key point to note is the content in edx: it represents
the benchmark number to be executed!
The table below illustrates all the numbers for each benchmark:
+----------------------------------------------------------+
+ Benchmark                                |  Bench number |
+----------------------------------------------------------+
+ FileCompressionWorkload::worker(int)     |   0x65        +
+ NavigationWorkload::worker(int)          |     66        +
+ HTML5BrowserWorkload::worker(int)        |     67        +
+ PDFRenderingWorkload::worker(int)        |     68        +
+ PhotoWorkload::worker(int)               |     69        +
+ ClangTBBWorkload::worker(int)            |     c9        +
+ PythonWorkload::worker(int)              |     ca        +
+ AssetCompressionWorkload::worker(int)    |     cb        +
+ ObjectDetectionWorkload::worker(int)     |  0x12d  <<<<  +
+ BackgroundBlurTBBWorkload::worker(int)   |  0x12e        +
+ HorizonDetectionTBBWorkload::worker(int) |  0x191        +
+ InpaintTBBWorkload::worker(int)          |  0x192        +
+ HDRTBBWorkload::worker(int)              |  0x193        +
+ CameraWorkload::worker(int)              |  0x194        +
+ RaytraceTBBWorkload::worker(int)         |  0x1f5        +
+ SfMTBBWorkload::worker(int)              |  0x1f6        +
+----------------------------------------------------------+
That said, since we only want to run the Object Detection (due to
significant discrepancies in results), we simply need to patch the value of
edx to 0x12d just before the call to WorkloadDriver::run(). Upon
return, we can terminate our program, like so:
3bb65c: 48 8b 7c 24 40  mov    0x40(%rsp),%rdi
3bb661: 8b 74 24 04     mov    0x4(%rsp),%esi
3bb665: 89 da           mov    %ebx,%edx
3bb667: 4c 89 f1        mov    %r14,%rcx
3bb66a: ba 2d 01 00 00  mov    $0x12d,%edx   ; <<< Set our benchmark here!

; Call the function
3bb66f: e8 2c 4f 00 00  callq  3c05a0 <_ZN14WorkloadDriver3runE11SectionType12WorkloadTypePK15WorkloadOptions>

; Exit 0
3bb674: b8 3c 00 00 00  mov    $0x3c,%eax
3bb679: 48 31 ff        xor    %rdi,%rdi
3bb67c: 0f 05           syscall
Note that, since we've added 5 bytes before BC(callq), the address offset needs
to be subtracted by 5. In other words, change e8 31 4f 00 00 to
e8 2c 4f 00 00.
You can now easily patch your Geekbench v6.2.0:
$ printf "\xba\x2d\x01\x00\x00\xe8\x2c\x4f\x00\x00\xb8\x3c\x00\x00\x00\x48\x31\xff\x0f\x05" | dd of=geekbench_x86_64 bs=1 seek=$((0x3bb66a)) conv=notrunc
Simply replace \x2d\x01 (little-endian) with the benchmark you want to
execute.
Perf-ing them all!
Before diving into perf, let's ensure everything is running smoothly. We'll
run Geekbench as usual to see what happens now (click to enlarge):
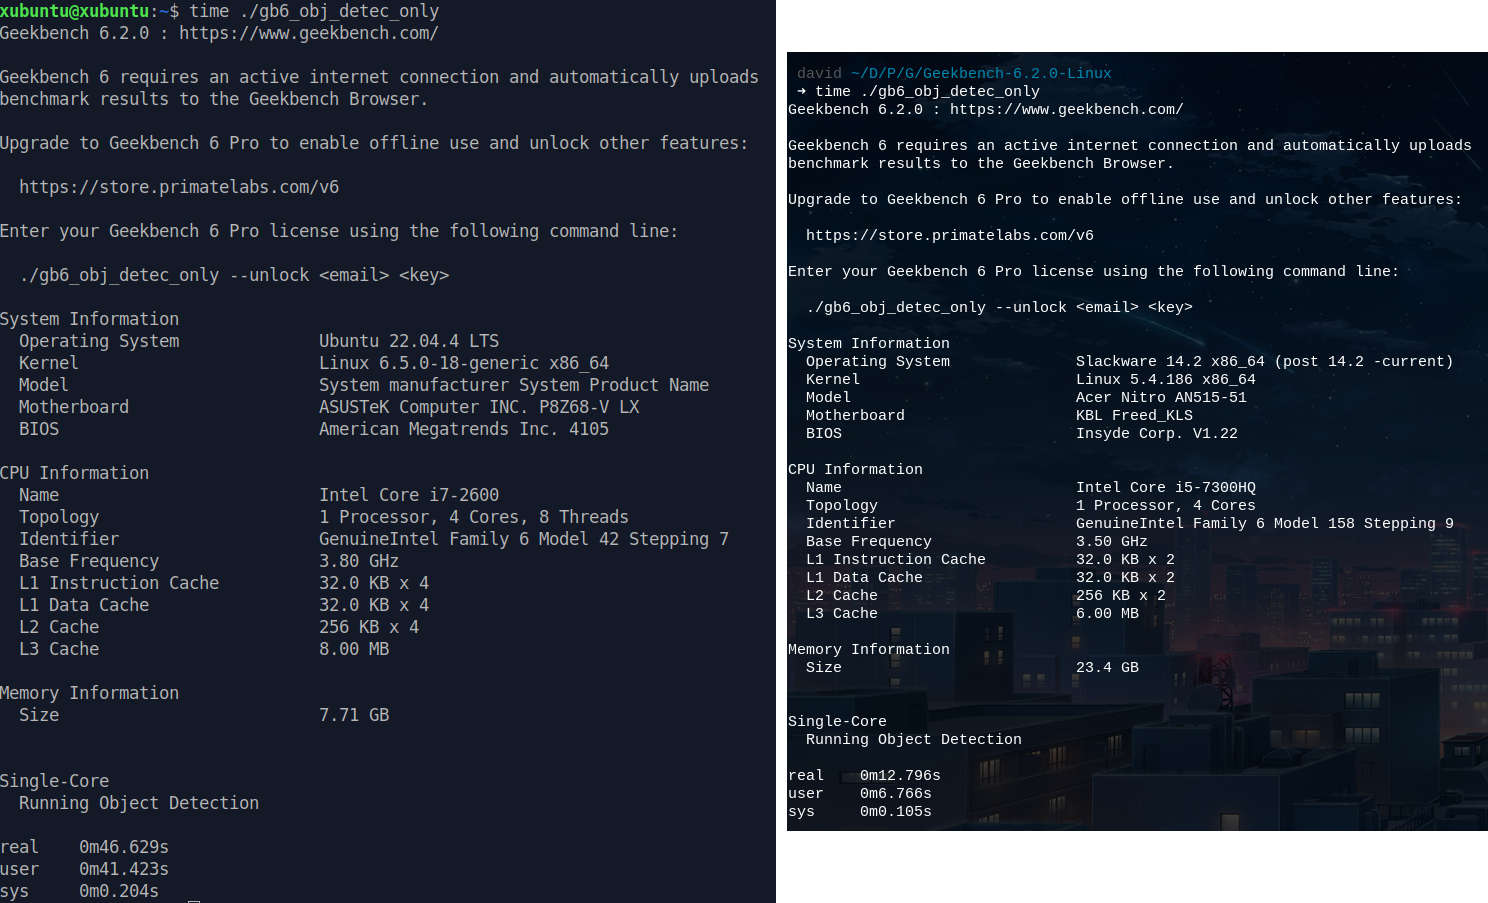
Image 4: Patched Geekbench v6.2.0 running only Object Detection test
It worked! I must admit, I was quite skeptical about this.
What's even better: we can already notice a big initial difference between the
i5 and the i7 in these preliminary results... what insights will perf
provide us?
Running perf with perf record --call-graph dwarf ./gb6_obj_detec_only
yields a perf.data file of 228M, a significant leap compared to before. On
the desktop, it reached around \~1.2GB.
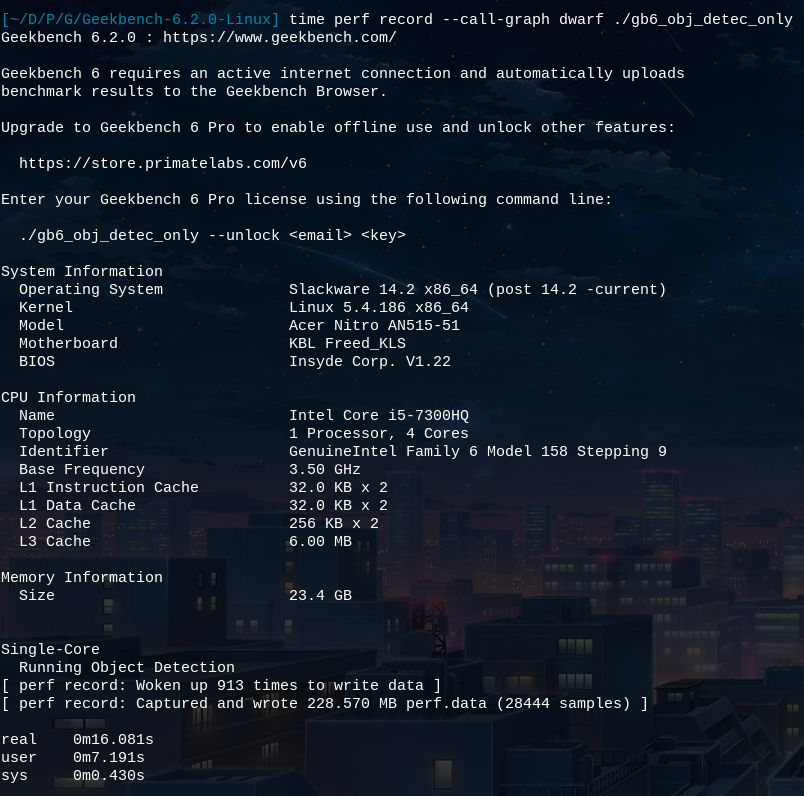
Image 5: Perf record
Reports!
Let's dive into the final results. Below, you'll find perf reports for the
i7 and i5 processors, respectively. A quick reminder: these reports pertain to
the execution of Geekbench v6.2.0 (also applicable to v6.3.0) using the
geekbench_x86_64 binary (click on the images to enlarge):
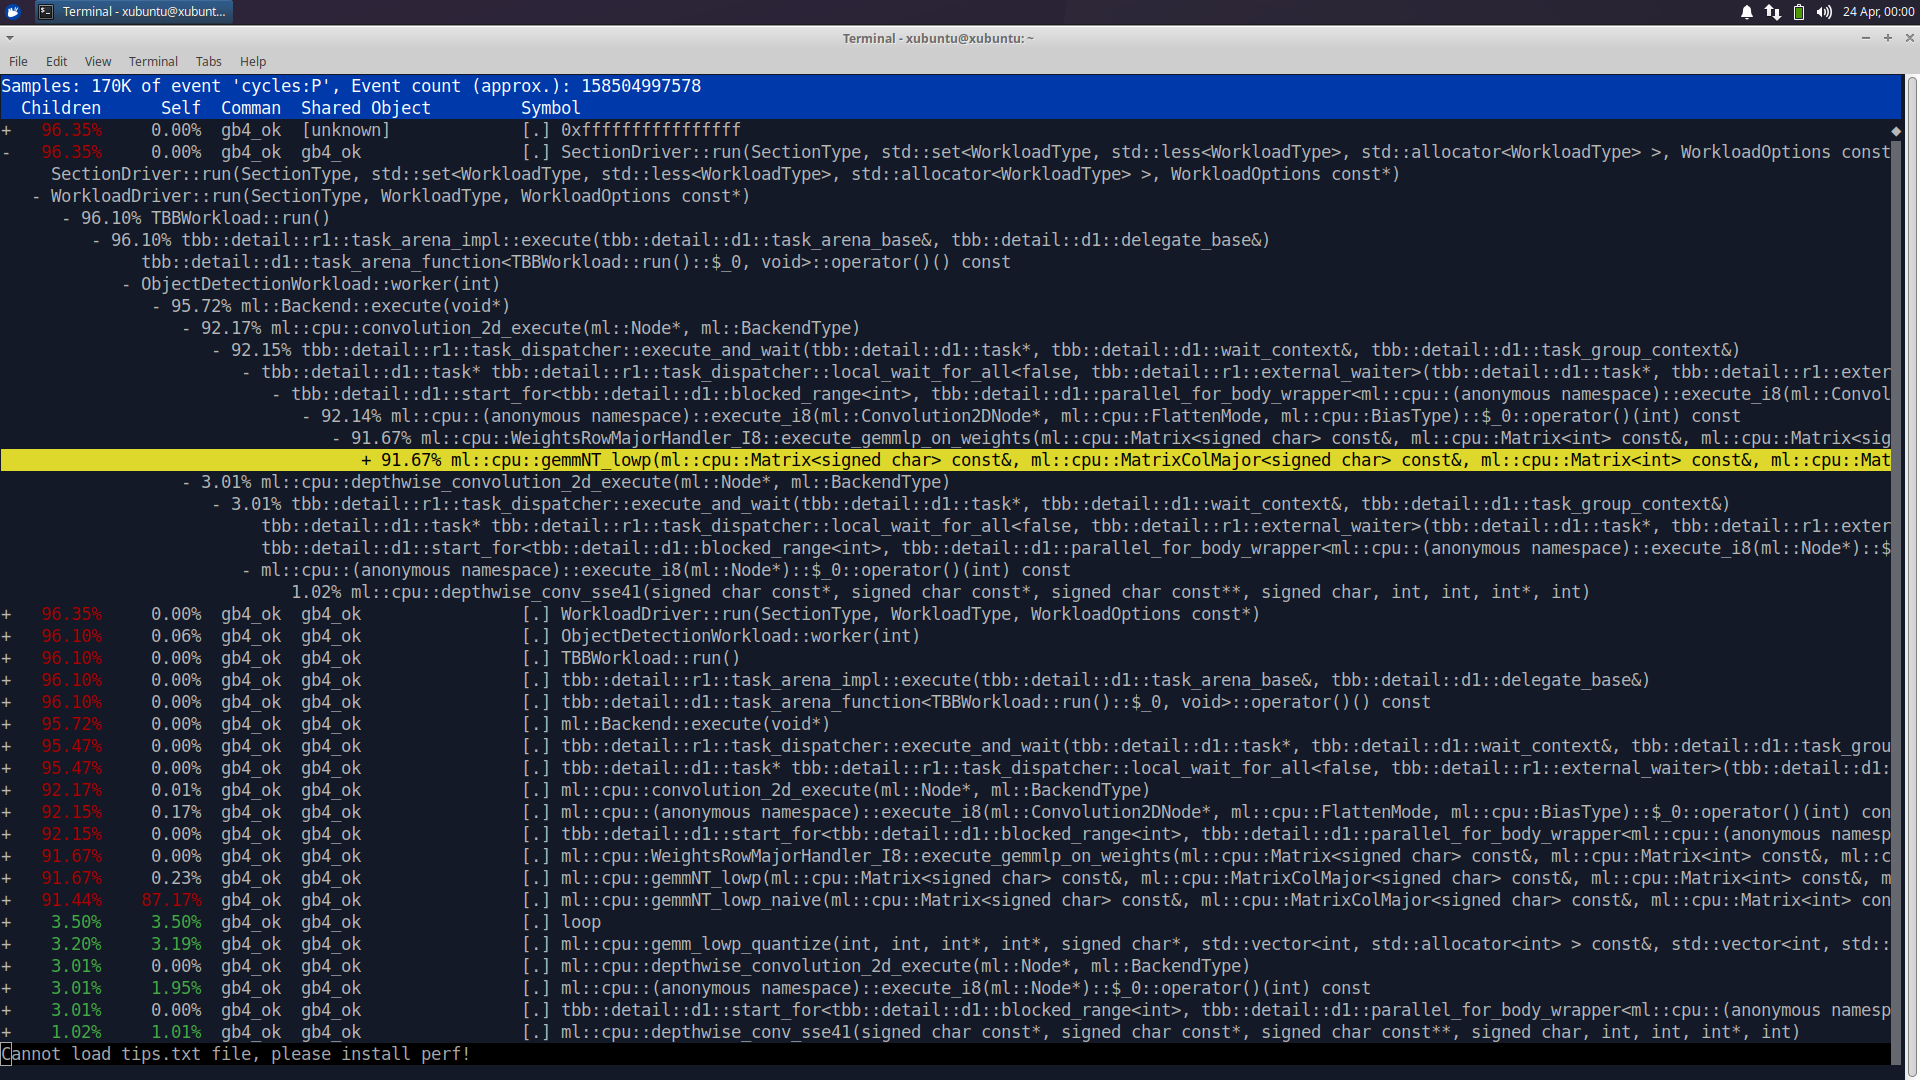
Image 6: Perf report for i7 2600
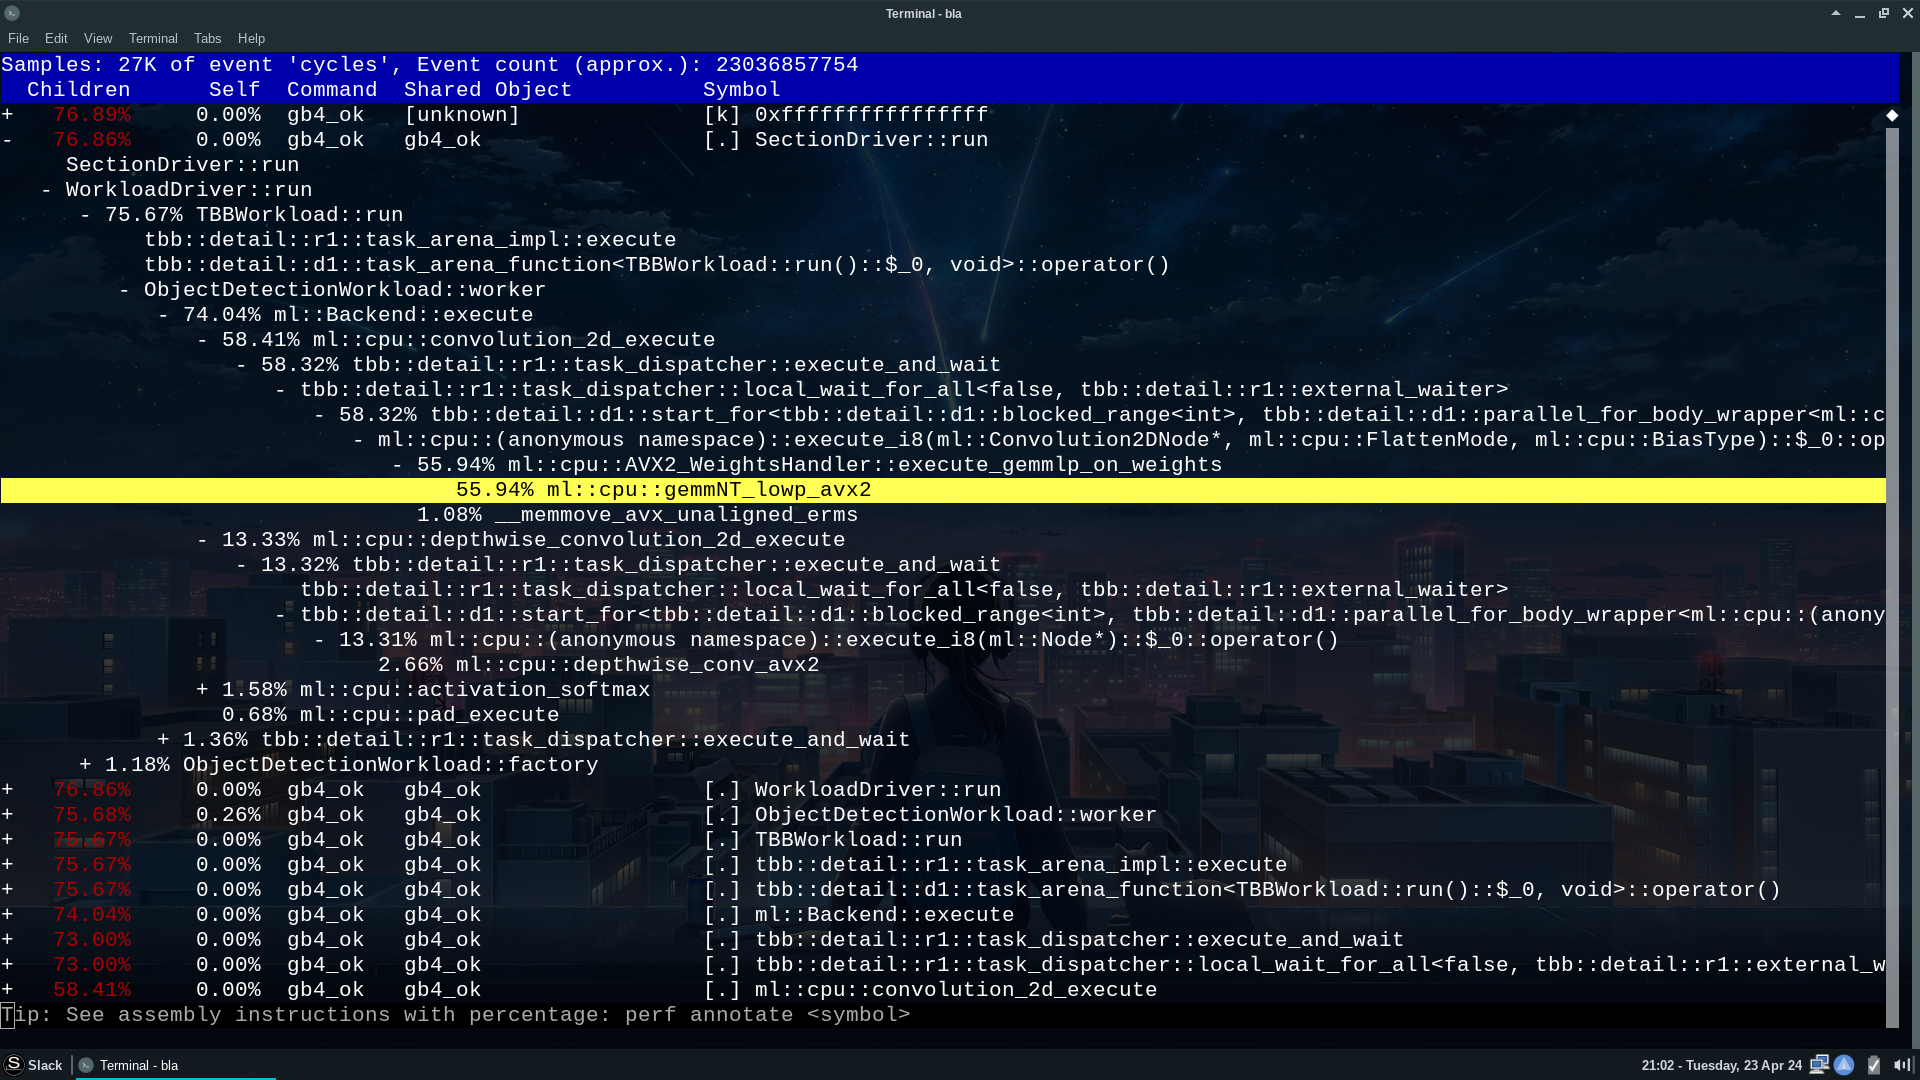
Image 7: Perf report for i5 7300HQ
This can't be happening... let's examine the instruction annotations:

Image 8: Perf report for i7 2600, most used instructions

Image 9: Perf report for i5 7300HQ, most used instructions
Observing the Object Detection test, we find the invocation of the function
ml::cpu::gemmNT_lowp(). However, there are at least two versions of this
function: the one mentioned earlier and also ml::cpu::gemmNT_lowp_avx2().
Furthermore, the usage of instructions such as vpmovsxbw, vpbroadcastw,
and so on clearly indicates the evident use of AVX2. On the i7 side,
instructions like punpcklbw, psrad, paddd, and so forth are used,
all from SSE2!.
If it's not clear yet, there are two major issues with this code:
- AVX2 Usage in a Supposedly Generic x86_64 Binary: The binary should ideally support any x64 CPU. However, it's evident that there's a runtime dispatcher selecting the best code path based on the CPU.
- Lack of Support for Instruction Sets Below AVX2: Between SSE2 (supported
even by Pentium 4!) and AVX1 (supported by my i7), there's a plethora of SIMD
instructions, including
SSE3,SSSE3,SSE4,SSE4.1 + SSE4.2, andAVX. This benchmark (and possibly others) is extremely binary: it either supports AVX2 or SSE2. This severely limits precise benchmark evaluations of everything a CPU has to offer. My i7 was effectively using the same instruction set as a Pentium 4!
I understand that supporting multiple SIMD code variations is challenging, and
writing code for AVX1 is more complex than for AVX2. However, this
evaluation remains unfair.
If they want to implement support solely for AVX2, that's fine. But please
ensure that geekbench_x86_64 runs exclusively with SSE2. Otherwise, we're
comparing apples to oranges.
Is There a Fix?
Surprisingly, yes!
Dissatisfied with the results, I decided to investigate the geekbench_x86_64
binary once again and found the following function:
5e8a70 <_Z17is_avx2_availablev>, invoked from the following backtrace:
#0  0x0000555555b3ca70 in is_avx2_available() ()
#1  0x0000555555a4ad7e in ml::cpu::convolution_2d_prepare(ml::Node*) ()
#2  0x0000555555a47de7 in ml::Backend::prepare() ()
#3  0x0000555555936c3e in ObjectDetectionWorkload::ObjectDetectionWorkload(SectionType, WorkloadOptions const*) ()
It's a simple function that returns 1 if available and 0 if not, which can be easily patched with:
0x00000000005e8a70 <_Z17is_avx2_availablev>:
  0x5e8a70:   48 31 c0                xor    %rax,%rax
  0x5e8a73:   c3                      retq
If you want to 'fix' your Geekbench v6.2.0:
printf "\x48\x31\xc0\xc3" | dd of=geekbench_x86_64 bs=1 seek=$((0x5e8a70)) conv=notrunc
And finally, I was able to obtain the following final result:
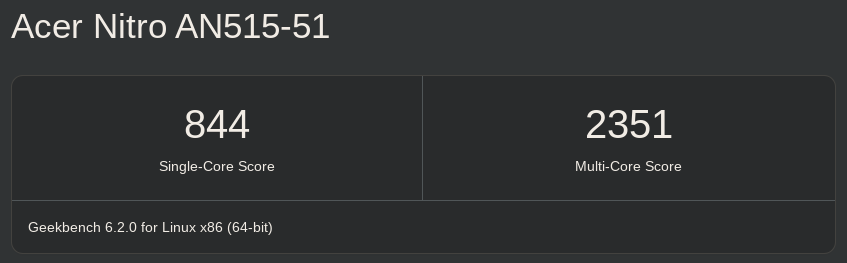
Image 10: Fixed Geekbench result
which you can also check on the Geekbench website.
Final Thoughts
I am a big fan of Geekbench and have been using it for several years. However, I was somewhat surprised by these results, which lead me to not recommend version 6 for mixed CPU comparisons involving support for AVX2 and non-AVX2 instructions. The results will be inaccurate, and under these circumstances, I can only recommend using Geekbench v5.
Given its closed-source nature, what would certainly take me a day to analyze, I spent several days, which is precisely why I will always advocate for the use of FOSS.
On a positive note, the binaries for Geekbench v6.2.0 were not stripped (fortunately! I hope this doesn't change). The project appears to be a well-written C++ code, which posed me an extra challenge to understand the generated asm code. The use of Intel TBB for multi-threading is also noteworthy.
ℹ️ Info: Although all the analysis discussed here was done in v6.2.0, the same issues also occur in the latest version, v6.3.0.
This post is licensed under CC BY 4.0 by the author.